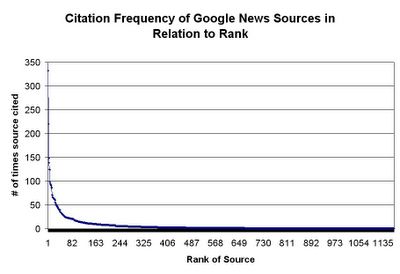
Just since I threw it into a spreadsheet, I realized I would love to share a simple frequency histogram and throw out some descriptive stats (arbitrarily chosen by the author):
These numbers are as of 8PM on 3/28/2005... they are constantly changing (bastards):
1172 total sources cited
7770 total stories
Mode of 1
Median of 2
Mean of 6.629692833
Standard Deviation of 17.8597173
The top thirty sources have a minimum of 50 stories cited from their pages and make up 2.56% of the total sources cited, yet have 35.44% of the stories (2,754) cited on Google News by volume.
The top 164 sources have a minimum of 10 stories cited, making up 13.99% of the total number of sources, yet have 69.14% of the stories (5,372) cited by volume.
The bottom 506 sources have one story cited by Google News, making up 43.17% of the total number of sources, but only having 6.51% of the total stories cited by volume.
Here is a snazzy graph showing the long tail and the distribution skewed to the left with a long tail to the right...

Fun With Scraped Data...

google news sources citations

No comments:
Post a Comment